Live Activity Table
See every signal, computed, and effect update in real-time. Sort by most recent, most active, or alphabetically. Filter by component or search by name.
SigTrace shows exactly what changed, what re-ran, and what triggered it, so you can fix Angular, Vue, Solid, React, and Svelte signal bugs faster inside your editor.
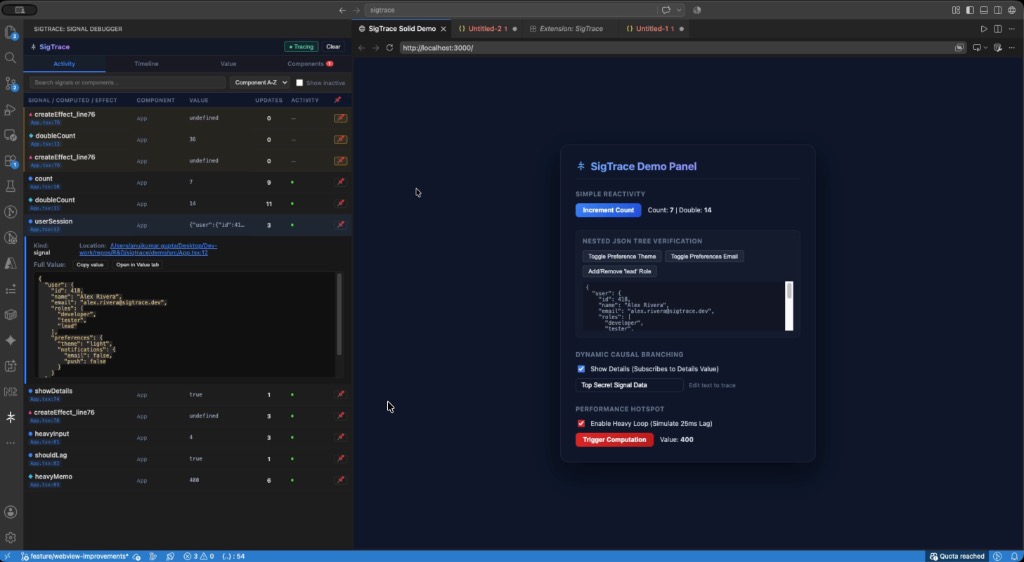
▲ SigTrace panel — live signal activity inside VS Code
No more guessing through console.logs. Shows a live, filterable table of signal reads, writes, and effect triggers in real time. Spot which signals are over-triggering and sort by update counts to isolate jitter instantly.
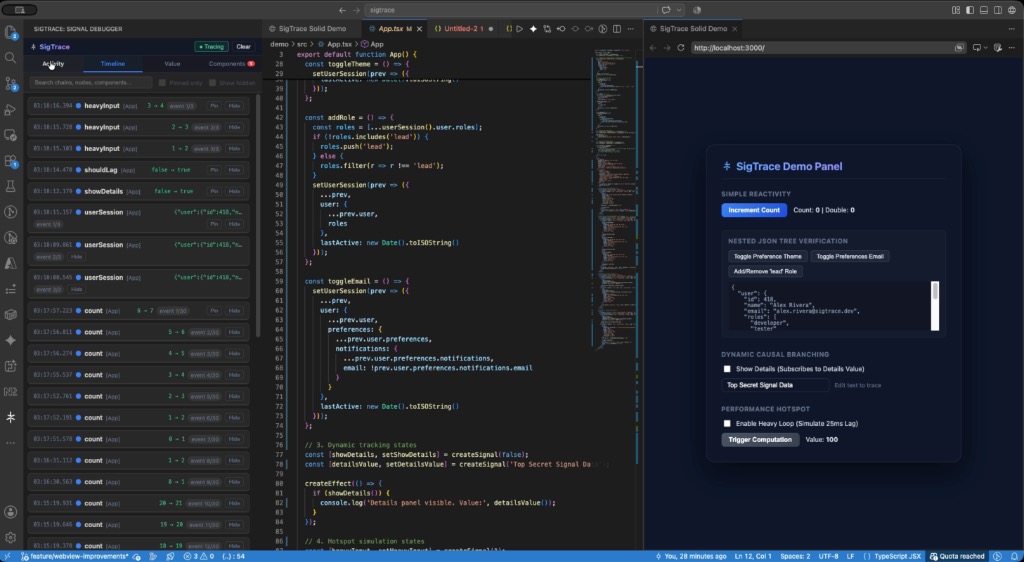
▲ SigTrace panel — causal propagation timeline of signal events
Trace the exact propagation tree of a signal update. Follow every computed evaluation and effect reaction in order (e.g. event 1/7). Unpin or hide chains to isolate clean causal pathways.
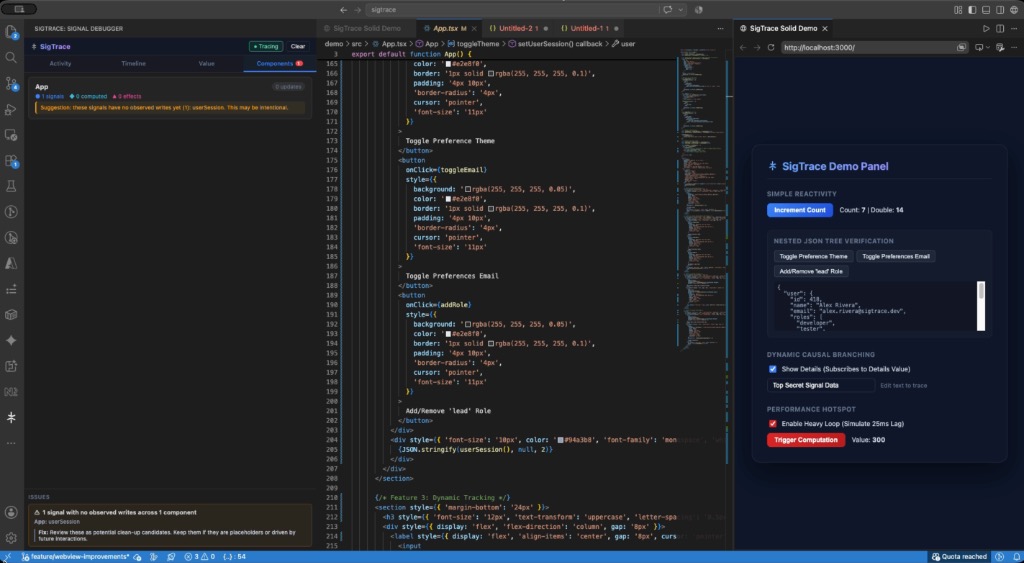
▲ SigTrace panel — component signal usage analysis and performance alerts
Audit your application's reactive health inside the IDE. Spot components with heavy work counts, discover computation hotspots taking >2ms, and clean up dangling dead signals before committing.
localhost:8420 only
SigTrace gives you full visibility into your signal graph — from individual reads and writes to full causal chains spanning multiple components.
See every signal, computed, and effect update in real-time. Sort by most recent, most active, or alphabetically. Filter by component or search by name.
Every signal write triggers a chain view showing exactly which computed values re-evaluated and which effects ran — with precise millisecond timing and hotspot detection.
Group signals by component. Identify unused signals, locate the slowest computed nodes, and understand which components drive the most reactive work.
Every signal row shows its source file and line number. Click once to jump directly to the declaration in your editor. Double-click any row to navigate instantly.
Click to expand any signal and see its complete, pretty-printed JSON value with no truncation. Hover over values in the timeline for full content tooltips.
Work across multiple VS Code windows at once. The first window becomes the WebSocket host. Every new window auto-joins as a client and receives all signal events live. If the host window closes, any client instantly self-promotes — zero reconnection steps, zero signal loss.
SigTrace ships with dedicated adapters for every major reactive framework. One extension, one dashboard, all your signals.
SigTrace instruments your signals at build time via AST compilation. Select your framework below — steps differ slightly depending on whether your project uses Angular CLI or Vite.
Search "SigTrace" in the VS Code Marketplace or JetBrains Plugins and click Install.
@sigtrace/core onlyAngular CLI projects do not use Vite. You only need to install our core CLI & tracer package.
Serve with npx sigtrace run ng serve. AST code instrumentation is done on the fly — no config changes needed!
Every signal(), computed(), effect(), and toSignal() update appears live.
Search "SigTrace" in the VS Code Marketplace or JetBrains Plugins and click Install.
Install both the core tracer and the Vite plugin: npm i -D @sigtrace/core @sigtrace/vite.
Add sigTrace() to your vite.config.ts. See the code panel →
Run npm run dev (no prefix needed!). The plugin handles code transformations in the background.
Search "SigTrace" in the VS Code Marketplace or JetBrains Plugins and click Install.
Install both the core tracer and the Vite plugin: npm i -D @sigtrace/core @sigtrace/vite.
Add sigTrace() to your vite.config.ts. See the code panel →
Run npm run dev (no prefix needed!). The plugin handles code transformations in the background.
Search "SigTrace" in the VS Code Marketplace or JetBrains Plugins and click Install.
Install both the core tracer and the Vite plugin: npm i -D @sigtrace/core @sigtrace/vite.
Add sigTrace() to your vite.config.ts. See the code panel →
Run npm run dev (no prefix needed!). The plugin handles code transformations in the background.
Search "SigTrace" in the VS Code Marketplace or JetBrains Plugins and click Install.
Install both the core tracer and the Vite plugin: npm i -D @sigtrace/core @sigtrace/vite.
Add sigTrace() to your vite.config.ts. See the code panel →
Run npm run dev (no prefix needed!). The plugin handles code transformations in the background.
127.0.0.1:8420 (localhost). The editor extension connects to this local server and receives signal events. There is no cloud backend, no telemetry, no analytics, no crash reporting. You can verify this by reading the source: packages/core/src/index.ts shows the WebSocket connect line.npx sigtrace run and all signals are tracked without any imports, decorators, or code changes.NODE_ENV=production guard. If it is somehow bundled into a production build, it emits a clear console warning and degrades to a complete no-op — no WebSocket connection, no instrumentation, no performance impact. To prevent this: install @sigtrace/core as a devDependency and use npx sigtrace run only in local dev scripts, not in CI/CD pipelines.Install SigTrace and get full visibility into your signal graph — for free, forever.